Tracking the Daily Impact of Coronavirus on Television Advertising

TV viewing should be on the rise due to the coronavirus pandemic leaving millions of Americans housebound.  For direct-to-consumer television campaigns, who are able to measure consumer response and campaign performance in real time, will greater television viewership levels help to sustain the industry or will there be a pull back?  The U.S. economy relies heavily on consumer spending so how consumers respond to this type of advertising in coming days will determine the impact to this 17.8 billion dollar industry sector.  If traditional brand advertisers pull back, will we see more direct-to-consumer advertising filling the gap and, if so, what types?

To help answer these questions, DRMetrix has published a new interactive chart on its website that shows the daily airing count (ad units) for different classifications of direct-to-consumer advertising across 130 national networks monitored by its AdSphere research system.  The chart shows ad units by day beginning March 1 and will update daily.  One can see a recurring decrease in ad units on weekends which is normal.  It may take a week or two before the chart begins to paint a picture of what’s happening.

CLICK PICTURE ABOVE TO SEE LIVE CHART

DRMetrix’s chart shows the ad units for different classifications of the direct-to-consumer television industry as follows:

Traditional Direct Response (“DR”) Campaigns 

(Campaigns using differing phone, web, or SMS codes in order to better track consumer results back to specific networks, dayparts, and TV creatives).

Short Form Products – Traditional call-to-order $19.95 types of campaigns.
Lead Generation – Campaigns that don’t advertise the full price of the product or service (ie: call for free information)
28.5 Minute Infomercials – Those late night program length advertisements

Brand/Direct Campaigns

(Campaigns using a single vanity phone or URL which makes it more challenging to measure the immediate impact of television)

Vanity 800 – Campaigns using a vanity 800 call to action
Web/Mobile/SMS – Campaigns that use a vanity web, mobile app, or SMS call to action

To learn more about these classifications, and historical trends over the past 5 years, please download DRMetrix’s latest industry study.

DRMetrix wishes to extend our thoughts and prayers for everyone’s safety and health during these trying times.  As an industry, we will get through this together.  Due to the cancellation of PDMI East, we will be celebrating our industry’s accomplishments, and honoring the top advertisers of 2019, at PDMI West in September.

====

3/25/2020 Update – New “Cause of Change” section has been added to the report today.  For each brand classification, the top 10 daily brands are listed with the number of (+) plus or (-) minus ad units compared to the prior day.  Each brand listed includes a clickable play link.  Enjoy!

4/14/20 Update – Added toggle at top of graph to switch between daily or weekly data views.  Access historic cause of change results for any prior day or week by “clicking on” data points in top graph.  

4th Annual AdSphere™ Award Winners Announced

4th Annual AdSphere™ Awards Recognizing Top Direct-to-Consumer Advertisers in 2019

AbbVie, Progressive, Nutrisystem, E. Mishan & Sons, Guthy-Renker, Lifelock, Luminess Direct, Proactiv+, among those taking top honors.

SAN DIEGO- (March 10, 2020) – Direct-to-consumer television advertisers spent over 17.8 billion on national cable and broadcast networks in 2019.  To celebrate the industry’s accomplishments, DRMetrix’s 4th Annual AdSphere Awards is honoring the industry’s top advertisers and brands.

The awards presentation will take place at PDMI EAST 2020, where the leaders in Performance-Driven Marketing will come together in Miami, Florida from April 19 – 21, 2020Due to Coronavirus this year’s award program will be rescheduled to PDMI WEST in San Diego, September 14-16.  All of us at DRMetrix wish to extend our thoughts and prayers for everyone’s safety and health during these trying times.

AdSphere Awards is the first awards program to be inclusive of the entire direct-to-consumer industry with advertisers such as Facebook, Credit Karma, Peloton Cycle, Legal Zoom, Chewy.com, Carvana.com, Booking.com, and many others being honored.

“The AdSphere awards recognize best-of-class advertisers and brands across four industry classifications including short-form products, lead generation, brand/direct, and 28.5-minute infomercials,” said Joseph Gray, AdSphere Awards founder and CEO of DRMetrix.  “Direct-to-consumer campaigns achieving this level of scale demonstrate consumer popularity and best-in-class creative and media execution.  The AdSphere Awards are the most inclusive award program for the entire direct-to-consumer industry recognizing nearly 70 honorees including all of our best-of-category award recipients.”

AdSphere monitors a universe of 130+ national networks on a 24/7/365 basis.  In just over five years, AdSphere has identified over 11,000 direct-to-consumer brands.  In addition to detecting over 495,000 infomercial (28.5 minute) airings, AdSphere has detected over 55 million spots of varying creative lengths up to five minutes in duration.  The awards recognize top brands across a wide range of industry categories representing all facets of the industry.  AdSphere segments campaigns across over 190 major categories and sub-categories. The complete list of AdSphere Award winners is online at www.drmetrix.com/adsphere-awards.html.

In addition to the “Best of Category” awards, the following top nine advertisers will receive the coveted AdSphere Award.

2020 AdSphere™ Award Winners – Top Nine Categories

1.           2019 – Advertiser of the Year
              Classification -Brand/Direct
              AbbVie
2.           2019 – Brand of the Year
              Classification  Brand/Direct
              Progressive
3.           2019 – Advertiser & Brand of the Year
              Classification – Lead Generation
              Nutrisystem
4.           2019 – Advertiser of the Year
              Classification – Short Form Products
              E. Mishan & Sons
5.           2019 – Brand of the Year
              Classification – Short Form Products
              Proactiv+
6.           2019 – Advertiser of the Year
              Classification – Long Form
              Guthy | Renker
7.           2019 – Brand of the Year
              Classification – Long Form
              LifeLock
8.           2019 – Brand of the Year
              Classification – Long Form Retail Products
              Luminess Silk Infinite Beauty Collection
9.           2019 – Brand of the Year
              Classification – Short Form Retail Products
              GraniteStone / GraniteRock

About DRMetrix

DRMetrix, the industry’s leading television research company, monitors over 130 national TV networks 24/7/365, tracking direct-to-consumer ads using all creative lengths including spot, 5-min, and long-form which include web addresses, mobile app response, SMS, or toll free numbers.  For more information, please visit www.drmetrix.com and be sure and download our latest direct-to-consumer industry study!

New February 2020 Build

We are dripping some new features on top of the FEB 2020 build which we’ll outline at the top of this post.

4-9-2020 Update – All ranking excel outputs now feature nested details on tab two (see image below). The excel outputs will take a little longer to run but now include all creative level details including play buttons good for 30 days. Now, it’s easier than ever to share creative details! Applying various filters to the ranking report, saving your filter settings, and using our new email automation features, allow for all kinds of exciting reporting options. Checkout our new updated Adsphere User Guide for all of the details!

Zoom in to Enlarge Image

3-5-2020 Update – We have made some minor UI enhancements to the main ranking system and included totals for airings and spend in the header of all ranking reports. This will make it much easier to trend spend levels over time without having to output a ranking report and total sum the columns. Here’s how it looks:

Totals in Header Column

These totals have also been added to the header of all excel ranking reports (see below).

AdSphere’s user interface has been updated to work better across different screen resolutions on desktops as well as laptops. Support for tablets and eventually mobile devices is planned for later this year.

We are also pleased to introduce a new Dark Mode for AdSphere which replaces the prior black theme. This is a far more comprehensive graphic treatment that we hope will make AdSphere easier on the eyes for some.

Introducing Advertiser & Brand Lists

We are excited to bring forth a new game changing feature to AdSphere called “Lists” which allows one to create and save a custom list of advertisers or brands. When a saved list is applied to the ranking system, airings data will be filtered for just those specific advertisers or brands. Up to 100 brands or advertisers can be saved per list. There is no limit on the number of lists that can be created and shared with other AdSphere users on your company’s account.

In November of last year, AdSphere introduced a new network excel feature that maps the spend for all advertisers or brands on a ranking report across networks, dayparts, and programs. Now, by combining these two features, one can map the aggregated spend across a custom list of advertisers or brands. Multi-advertiser & brand analysis is now possible saving time and improving results!

Below please find a video tutorial showing how to create a custom list of advertisers or brands. You’ll also learn how to apply that list to the ranking system and run a custom network excel output!

Update to Global Search

When using Global Search in AdSphere, you can now put quotes around a search term or phrase to limit results to exact full word/phrase matches.

As an example, in the case of Copper Fit (without quotes) approximately 111 brands are returned that have some association with either the word Copper or Fit. In contrast, search for “Copper Fit” (with quotes) narrows the results down to just 17 brands with the exact phrase “Copper Fit” in the name.

With new builds, we’re always on the hunt for bugs. If you find anything that seems odd, please send a report to support@drmetrix.com Thank you in advance for your help!

Happy Holidays!


New AdSphere Build – 12-11-2019

A new build of AdSphere was pushed today with a short list of feature enhancements and bug fixes.

A new “System Status” button has been added to the top of the Homepage. There has always been a system status page, as part of the Adsphere blog, but now a red indicator will appear on this button indicating when there is a new system status message to read. With a single click, you will now be able to navigate to the system status page!

The Blog button also has this new feature and a red dot will appear whenever there is a new AdSphere blog post, such as this one. Once you click on a button with a red dot, the red dot will be removed in order to alert you in the future to new content.

The “What’s New” button is also fully dynamic now. Currently there is a red dot with a value of “6” that appears on this button. As you click any of the of the six selections under this button, the value in the red dot will decrement by one. After you have clicked on all six of these items, the red dot will be removed until such time as there are additional new items to review.

Sneak Preview of what’s coming next…

Later this month, we plan to release a new feature that will allow you to create custom “lists” of brands and/or advertisers as a new type of ranking system filter! One can then apply said “lists” just like any other filter to create a custom ranking report which will only include data from the brands or advertisers of your choice. You will be able to create individual lists of brands and advertisers and give each list a unique name. You will be able to share your “lists” with colleagues similar to how reports and filters are shared! Lists can be applied and saved with any other combination of filters using the SAVE FILTER feature. This will allow for the creation of special ranking reports which you can schedule to be automatically emailed. When combined with the existing network excel output, users will now be able to study any custom list of brands or advertisers to determine top performing networks, dayparts, and programs!

Lists will be a powerful new filter that will allow DRMetrix to bring forth brand comparison and other new exciting features!

New AdSphere Build – 11-28-2019

Happy Thanksgiving!

DRMetrix pushed a new AdSphere build today which mainly focuses on system stability and bug fixes. We have also changed how we refer to DPI ad breaks in AdSphere. In many places, we previously referred to DPI ad breaks as “local DPI” or just “local” throughout the system and in various excel reports. In this new build, you will only see the term “DPI” which refers to airings detected in the DPI ad breaks on the networks. We have removed the term “local” as it has created too much confusion over the years.

If you are not familiar with DPI ad breaks, we encourage you to click on this link to learn more. You will discover that DRMetrix is the first television research provider that monitors commercial grade network feeds in a DPI compliant manner and what this means.

Previous to this change, DRMetrix found that many users were confusing “local breaks” and “local” to mean local market MVPD airings. Although we would try to explain that these terms refer to “local DPI ad breaks” on the networks, confusion remained. In an attempt to communicate more clearly, DRMetrix will standardize on the term “DPI” or “DPI ad break”. You will notice in all excel outputs where the term “local” was used previously, that the column headers will now simply read “DPI”. Also, instead of denoting DPI breaks with “L” in our excel outputs, we will pass the value “D” short for DPI. National ad breaks will continue to use “N”.

Welcome to the NEW AdSphere!


The biggest build, since the original launch of AdSphere

The new release of AdSphere marks a significant milestone but first, a big “thank you” to all of our users!  We could not have achieved this accomplishment without your support, feedback, and suggestions.

Since the creation of AdSphere, one of the biggest challenges has been how to provide insights into direct response spend in a responsible way.  We’ve heard from many that disclosure of remnant DR rates would hurt the industry.  We listened and have searched for a solution.  Initially, DRMetrix created its Spend Index methodology as a way for users to understand spend level differences between brands and advertisers without divulging remnant DR rates.  However, the Spend Index came with many shortcomings.  Over the past couple of years, we have been working on a more transparent and transformative solution.

Adsphere is the first television research system to segment the direct response industry into different classifications such as short form products, lead generation, and long form (28.5m).  These classifications are comprised of campaigns using DR variations to track response and ROI back to specific network/daypart/creatives.  When we say, “Know where ROI is found – Know AdSphere” we are referring to AdSphere’s unique ability to extract meaningful and actionable insights from these types of campaigns.  In contrast, Brand/DR campaigns use a vanity call to action and do not have the ability to track consumer responses or ROI back to specific network/daypart/creatives.  They have different objectives often translating their buys into traditional brand metrics.  Brand/DR advertisers pay higher rates for clearance given reach and frequency goals.  DRMetrix has been working to build the industry’s first rate database based on Brand/DR rates which will replace the Spend Index.  We have achieved this by receiving input from numerous agencies and advertisers, as well as collaborating with Standard Media Index (SMI), who works with many of the largest media holding companies in the industry.

In developing this new approach, our goal has been to provide directionally accurate insights that represent what the top of the marketplace is paying for network rotation-of-schedule (ROS) daypart inventory.   To clarify, DRMetrix is not using program specific brand rates nor are we using remnant DR rates.  Today, the majority of national ROS daypart inventory is being sold to Brand/DR advertisers.  Accordingly, using these rate metrics will provide the industry with a more realistic understanding of the size of the direct-to-consumer marketplace.  DRMetrix has also collaborated with leading infomercial agencies and advertisers to build a rate database for 28.5 minute infomercials.  To avoid industry disruption, we’ve added a premium to our infomercial rates.  By design, spend projections in the new build of AdSphere will be higher than traditional remnant DR spend.

As a new rate database, we expect that some anomalies will exist in the data where certain network ROS dayparts may be over or under weighted.  We ask our community for feedback so that we may improve the data over time.  To help expose anomalies, we are providing our users with an quick and easy way to provide feedback.  From the network dropdown menu on the AdSphere home page, or from any of the airing detail network pages, please look for the new “rate review” icon.  When you click on this icon, it will pop up a Network Rate Review form where you may provide feedback!

Disclaimer:  DRMetrix will make network / daypart rate adjustments as deemed appropriate based on community feedback and upon consultation with agency rate contributors and data partners.  As always, feedback from our community of users is greatly appreciated!

Aside from the Spend Index being replace to the favor of new directional Brand/DR rate averages, here are some of the other exciting feature enhancements you will find in this latest build of AdSphere.

Welcome to ABC, CBS, NBC, and FOX!

DRMetrix now monitors over 130 networks including ABC, CBS, NBC, and FOX!  If your favorite network isn’t monitored by DRMetrix, please request that they contact us!  Being part of the AdSphere industry platform helps networks attract more business and grow advertising revenue!


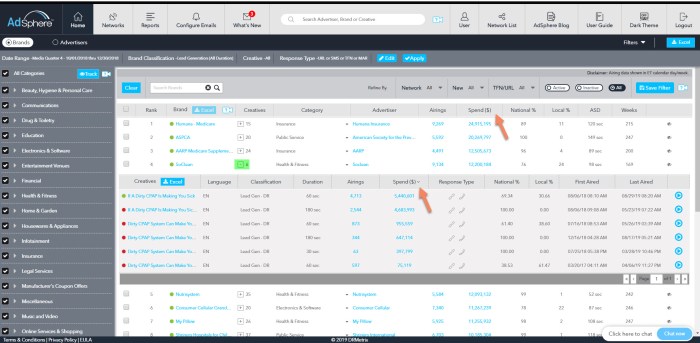
Rankings with Projected Spend Dollars for Advertiser, Brand, and Creatives

Now you have the freedom to track projected spend dollars by Advertiser, Brand, or Creative.  Get a better sense of spend levels across 170+ industry categories.  Trend 28.5 minute infomercial billings or any other creative length over time!  Trend spend by industry classification, creative language, response types, and more.  A treasure trove of industry data is now at your fingertips!


New Dynamic Airing Detail Page with Spend Metrics!

Directionally accurate spend metrics make a world of difference.  Analyze spend by network, program, daypart, breaktype, and more!  As a feature update, you can now change the date range without having to leave the airing detail page.  The page is also fully dynamic meaning that any filters applied will update the entire page which includes the network list on the bottom.  You can change the underlying data using any combination of networks, day of week, hour of day, standardized dayparts, and now even programs!  After you apply your filters and click apply, the entire page will update with the networks at the bottom sorted by either spend or airings.   With the addition of the program column, you can pop open a report showing the spend by program for any network on the fly with a convenient excel output.

As an example, let’s say you want to see the networks sorted by spend for weekend airings.  You can choose SAT/SUN from the “All Days of Week” dropdown and click Apply.  Now, only the SAT/SUN airings will be considered and the list of networks will be sorted by weekend spend.  Click the excel button on the bottom left to export all of the summary data based on your filter settings.


 New Network Filter Design

Rank Networks, Dayparts, and Programs by Industry Category!

Advertisers who use DR Variations in their commercials vote every day on the networks, dayparts, and programs that work best.  They vote with their wallet focusing on where ROI is found while discontinuing media that underperforms.  Now it is possible to analyze entire industry categories to determine which networks, dayparts, and programs are commanding the highest share of category dollars.

From the home page, click to open the new network filter.  As an example, let’s run a year-to-date report for the category Beauty, Hygiene & Personal Care.  (Alternatively, you can select any group of over 170+ categories in AdSphere).  Let’s also filter for the brand classifications short form products and lead generation in order to limit the results to just those creatives using DR Variations.

Now that we have our desired ranking report, we can determine the top networks, dayparts, and programs for the entire category.  In our example, there are over 80 brands and 179K airings for the Beauty, Hygiene & Personal Care category.  Open the network selector and click the new excel report as shown below.  You will receive a four tab report ranking network by spend, daypart by spend (M-F), daypart by spend (S-S), and program by spend.   Just like that, you have taken a survey of 80+ brands and discovered the best performing networks, dayparts, and programs!


New Dynamic Advertiser Pages with Spend Metrics!

Now, you can change the date range on Advertiser Pages and see projected spend for all brands and creatives.   When you click on an advertiser, brand, or creative hyperlink in the ranking system, the advertiser page will default to the same date range as the ranking report.  These pages will no longer default to lifetime view.  The only exception will be from Global Search where advertiser pages will continue to default to lifetime date range.

Custom Filter Reports – Automatically Emailed!

This new feature is designed to work with saved filter reports that use any of the six timeframes highlighted in the image.  When saving a filter with any of these settings, you may click the email button to have the report automatically run and emailed to you on the following schedule:

Current Week – Reports will be emailed at the end of each day

Current Month – Reports will be emailed either daily or weekly depending on your choice.

Current Quarter – Reports will be emailed daily, weekly, or monthly depending on your choice.

Last Week – Reports will be emailed at the end of each week.

Last Month – Reports will be emailed at the end of each month.

Last Quarter – Reports will be emailed at the end of each quarter.

A schedule email column has been added to the Filters dropdown as you can see in this picture.  Any filter that was created with one of the six choices above can have the email feature toggled on.  In the example shown, the schedule email box was clicked and a dialog box appears allowing the user to choice to receive the saved filter report daily or weekly.

New Configure Emails Tab

Your email tracking & alerts now appear alongside your scheduled filter report emails in one convenient place.  The new configure emails tab replaces the prior configure alerts tab.  It acts as a central hub for all of your Adsphere email communications.  You can filter the page for any combination of Category, Advertiser, Brand, or Network alerts as well as any saved filter email reports that you have scheduled.


We hope you have fun exploring this new build of AdSphere.  Upon release, please report any bugs you find to support@drmetrix.com so we can quickly fix them!